The following figure (not to the scale) shows a catchment $(\mathrm{Q}, \mathrm{S}, \mathrm{U}, \mathrm{T}, \mathrm{Q})$ and adjoining raingauge stations $\mathrm{P}, \mathrm{Q}, \mathrm{R}, \mathrm{S}, \mathrm{U}$ and $\mathrm{V}$. Due to a storm, $20 \mathrm{~mm}, 25 \mathrm{~mm}$, $30 \mathrm{~mm}, 15 \mathrm{~mm}, 22 \mathrm{~mm}$ and $18 \mathrm{~mm}$ rainfall depths were recorded by raingauges at $\mathrm{P}, \mathrm{Q}, \mathrm{R}, \mathrm{S}, \mathrm{U}$ and $V$, respectively.
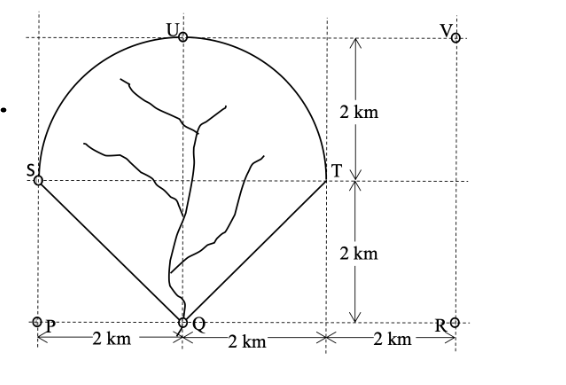
The corresponding mean rainfall over the catchment using Thiessen polygon method is____________ $\text{(in mm, rounded off to two decimal places).}$
