In an election, the share of valid votes received by the four candidates $\text{A, B, C}$, and $\mathrm{D}$ is represented by the pie chart shown. The total number of votes cast in the election were $1,15,000$, out of which $5,000$ were invalid.
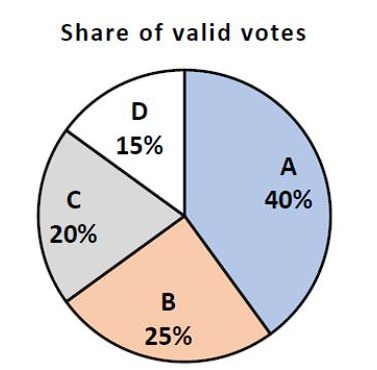
Based on the data provided, the total number of valid votes received by the candidates $\mathrm{B}$ and $\mathrm{C}$ is
- $45,000$
- $49,500$
- $51,750$
- $54,000$
