The following table and figure (not to scale) show characteristics of a catchment
$$\begin{array}{|c|c|c|c|} \hline \text{Sub-} & \text{Area} &\text{Runoff} & \text{Time of} \\
\text{catchment}
& (ha) & \text{coefficient} &
\text{concentration} \\
\hline \boldsymbol{P} & 750 & 0.5 & 1 \text{ hour} \\
\hline \boldsymbol{Q} & 1000 & 0.6 & 2 \text { hour} \\
\hline \boldsymbol{R} & 1500 & 0.6 & 3 \text{ hour} \\
\hline \boldsymbol{S} & 2000 & 0.7 & 4 \text{ hour} \\
\hline
\end{array}$$
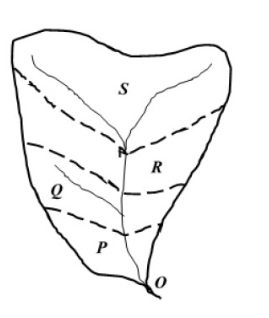
The hyetograph resulting from a storm that occurred uniformly over the catchment, is as follows
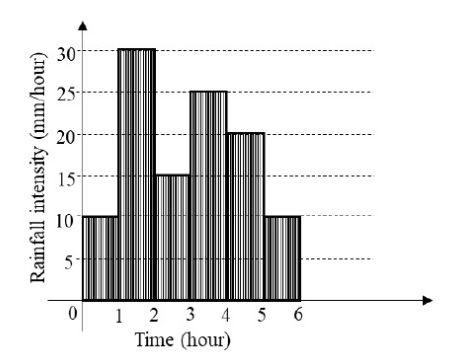
Assuming a constant base flow of $40 \mathrm{~m}^{3} / \mathrm{s}$, the peak of the runoff hydrograph produced by storm for the catchment at the outlet $\boldsymbol{O}$ is $\_\_\_\_\_ \: \mathrm{m}^{3 /} \mathrm{s}$. (rounded off to two decimal places)
