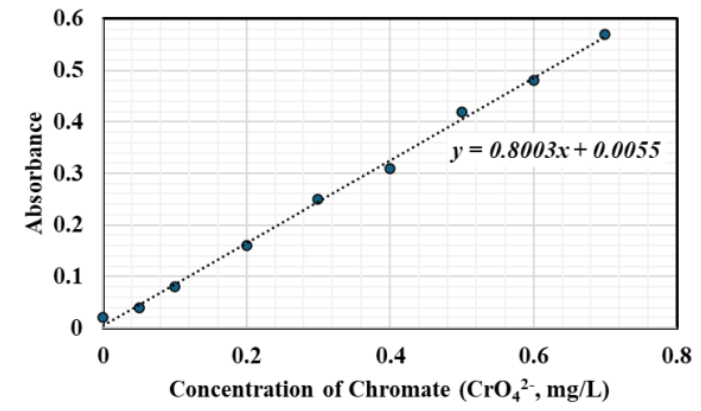
The calibration graph between absorbance and the concentration of chromate $\left(\mathrm{CrO}_{4}{ }^{2-}\right)$ in a water sample is shown in the figure.
For an absorbance of $0.35$ in a water sample, the estimated $\mathrm{Cr}(\mathrm{VI})$ concentration is $\_\_\_\_$ $\mathrm{mg} / \mathrm{L}$ (rounded off to two decimal places).
Use the atomic weight $(\mathrm{g/mol})$ of $\text{Cr}$ and $\text{O}$ as $52$ and $16$, respectively.